Building an analysis monitor for a genomics pipeline: Tracking remote analyses
![]()
A typical genomics data analysis lasts usually for several hours or even days, depending on the type of analysis performed. A common problem with these kind of analysis is that sometimes its hard, or inconvenient at least, to know the current status of the analysis being performed. In most cases it involves SSH-ing to remote machines, looking for logs and GREP-ing through them.
bcbio-nextgen is a python toolkit providing best-practice pipelines for fully automated high throughput sequencing analysis.
The problem
As mentioned before, tracking long-run analyses is not always easy on these kind of workflows, and bcbio-nextgen is not an exception. When running an analysis, the only way to know what’s the status of it is by looking into the logs. Wouldn’t it be nice, and more convenient, to have a simple frontend layer that displayed the progress of the current analysis? What if it could do so independently from the pipeline itself?
The solution
That’s precisely what bcbio-monitor does. Now, to build a frontend for such a piece of software like bcbio-nextgen, there are a couple of architectural decisions one needs to take. The very first question that came to my mind was:
Coupled or decoupled?
Do you want the tracker to be tighten to the software its tracking, in the sense of requiring it (installed) to function? You may think that’s the logical choice at first, but think about this: bcbio-nextgen, as many complex analysis pipelines has a lot of dependencies and its tricky to install. Even with all the facilities that Brad Chapman gives us to install bcbio, still time and computational resources are needed to install bcbio-nextgen. I thought that, to be a practical tool, the potential users should be able to install the monitor really quick on a personal computer and start tracking analyses wherever they’re running (which is generally a remote HPC or Cloud environment).
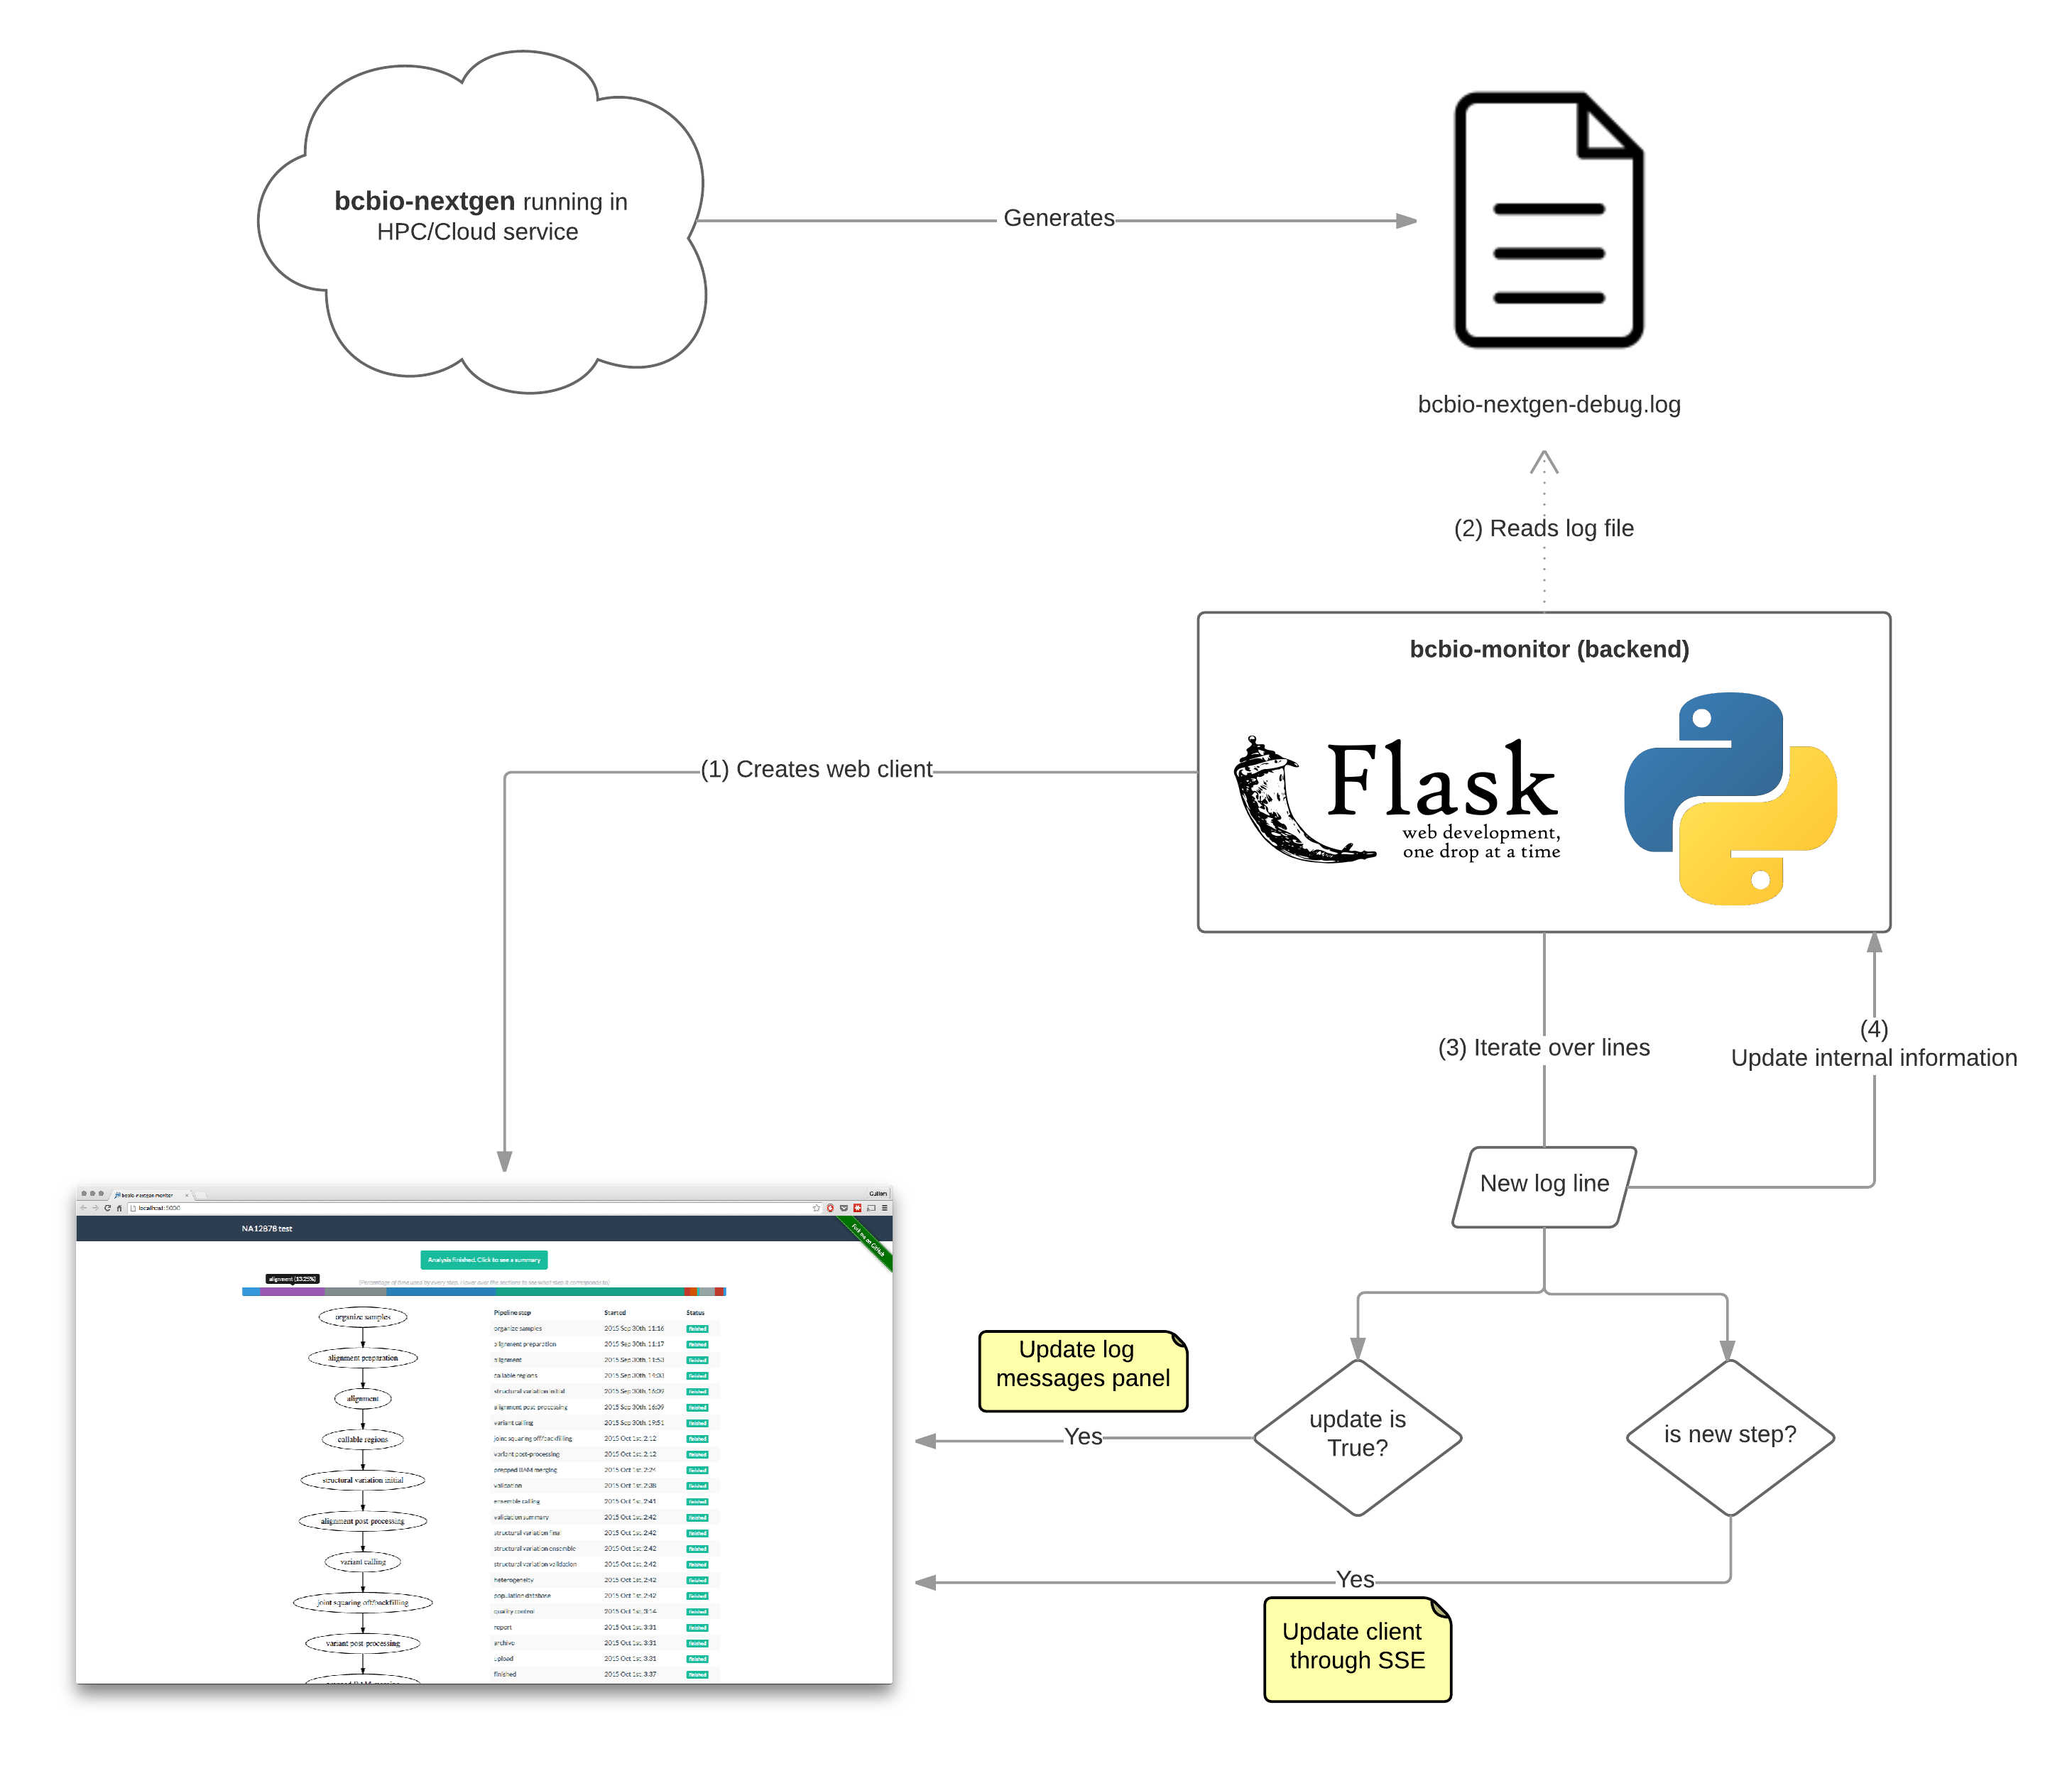
Every programmer should know the importance of good logging practices for any application, right? bcbio-nextgen does this really well. So I though that I could just use the information from the log that bcbio-nextgen generates, instead of inserting tracking code in the pipeline itself. This makes the monitor independent from the pipeline, making it possible to just read ongoing analyses log files to build a status graph, or even read finished analyses logs to get a global summary.
Updating the web client
Having decided to use the log file, we need a way to update the client application on every pipeline step. There are mainly two options:
Client-Server communication through polling
Though this would work fine, I wanted to avoid it mainly for two reasons:
- You have to define a polling interval yourself, which has to be sensitive given the update ratio of the pipeline. Its not easy to decide for a sensitive interval since the duration of different steps goes from seconds to hours.
- Even deciding for a good enough polling interval, by definition, polling implies hundreds or thousands of useless requests to the server.
Server-Client communication through HTML5 SSE events
The ideal solution would be to update the client only when a new step has finished, or when some relevant info (i.e an error in the analysis) needs to be presented to the user.
Doing some research I learned about SSE protocol in HTML5, and so I decided to go for that. SSE is precisely that: The client application subscribes to the server, who publishes messages that all subscribers will read. The protocol is robust, and even if you kill bcbio-monitor, when starting it again it will reconnect to the client.
With SSE, the client is updated only on important events, and no useless requests to the server are needed.
This is how the final architecture looks like:
bcbio-monitor: Features
Once the backend architecture was decided, the ““only”” thing remaining was to build the informative frontend application. As of by version 1.0, this is how bcbio-monitor looks like:
Progress flowchart and steps table
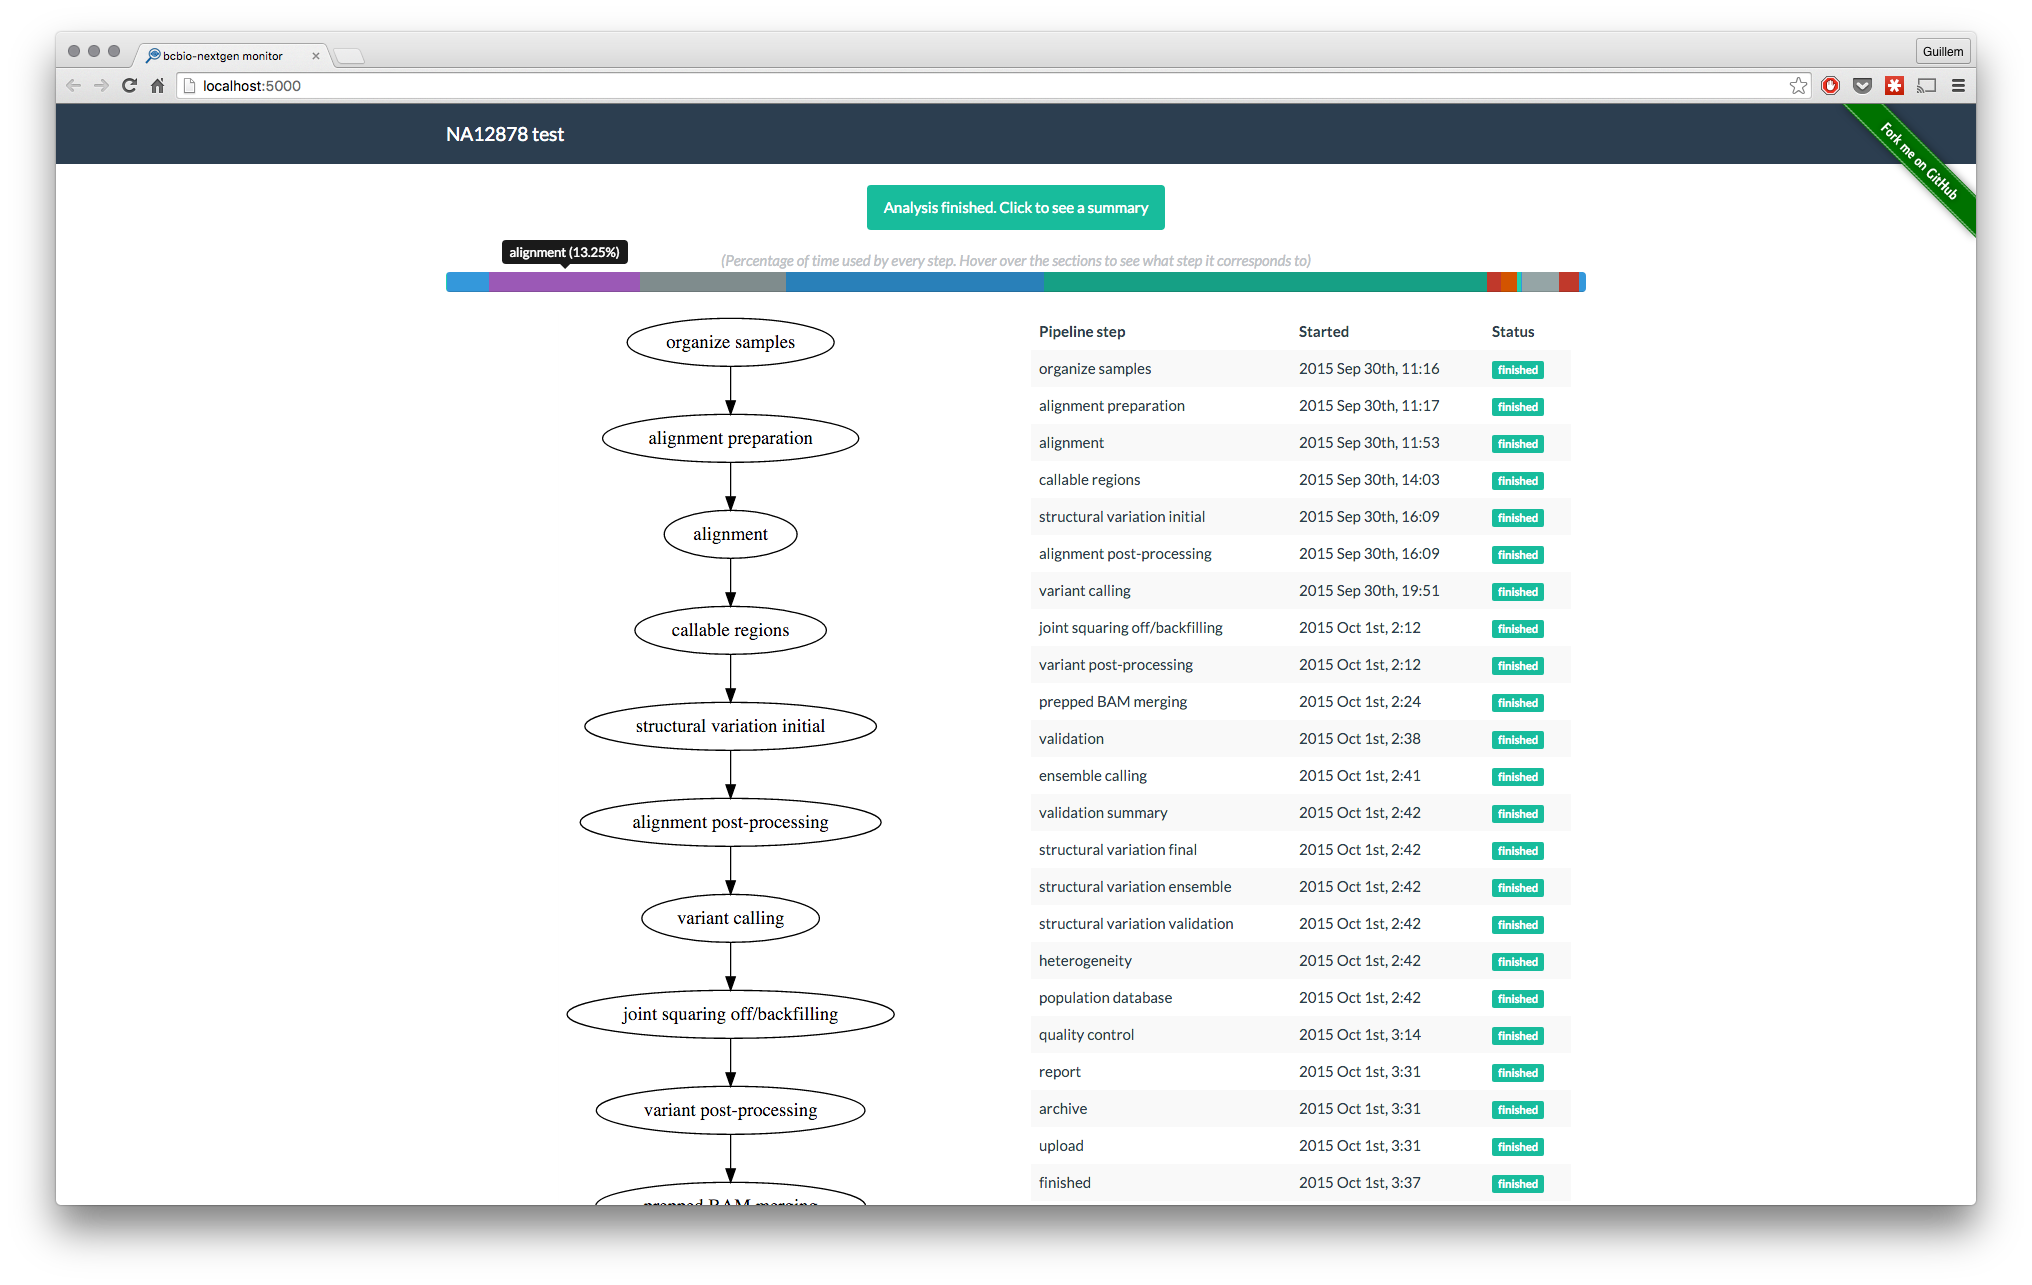
The table on the right gives the user information about the finished and running steps, as well as timing information readable by humans (thanks to momentjs). The flowchart on the left is, to be honest, not very informative on this version. The idea for the flowchart is to create branches for every computing node where the current step is running.
Percentage of time used by every step

For quick visual reference of which steps take the longer time
Constant feedback (optional)
Since the time between steps can be very long, and no feedback would be given to the user in several hours, I added the option of showing the last log message read on a small panel:
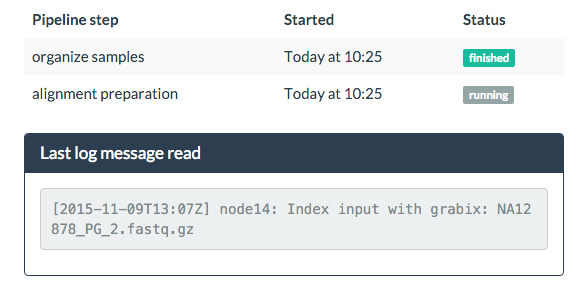
This can be deactivated starting bcbio-monitor with --no-update.
Error detection
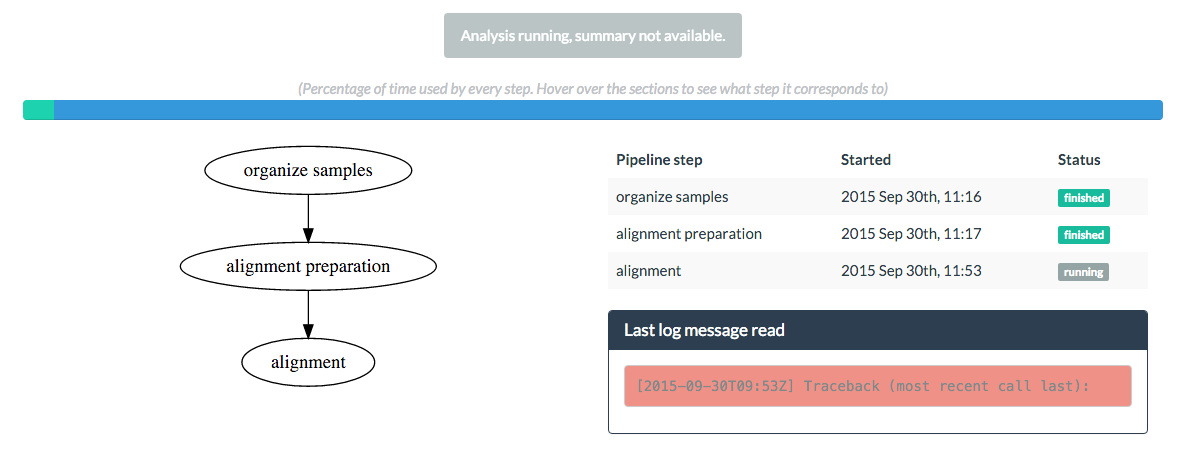
In case something goes wrong.
Summary for the analysis
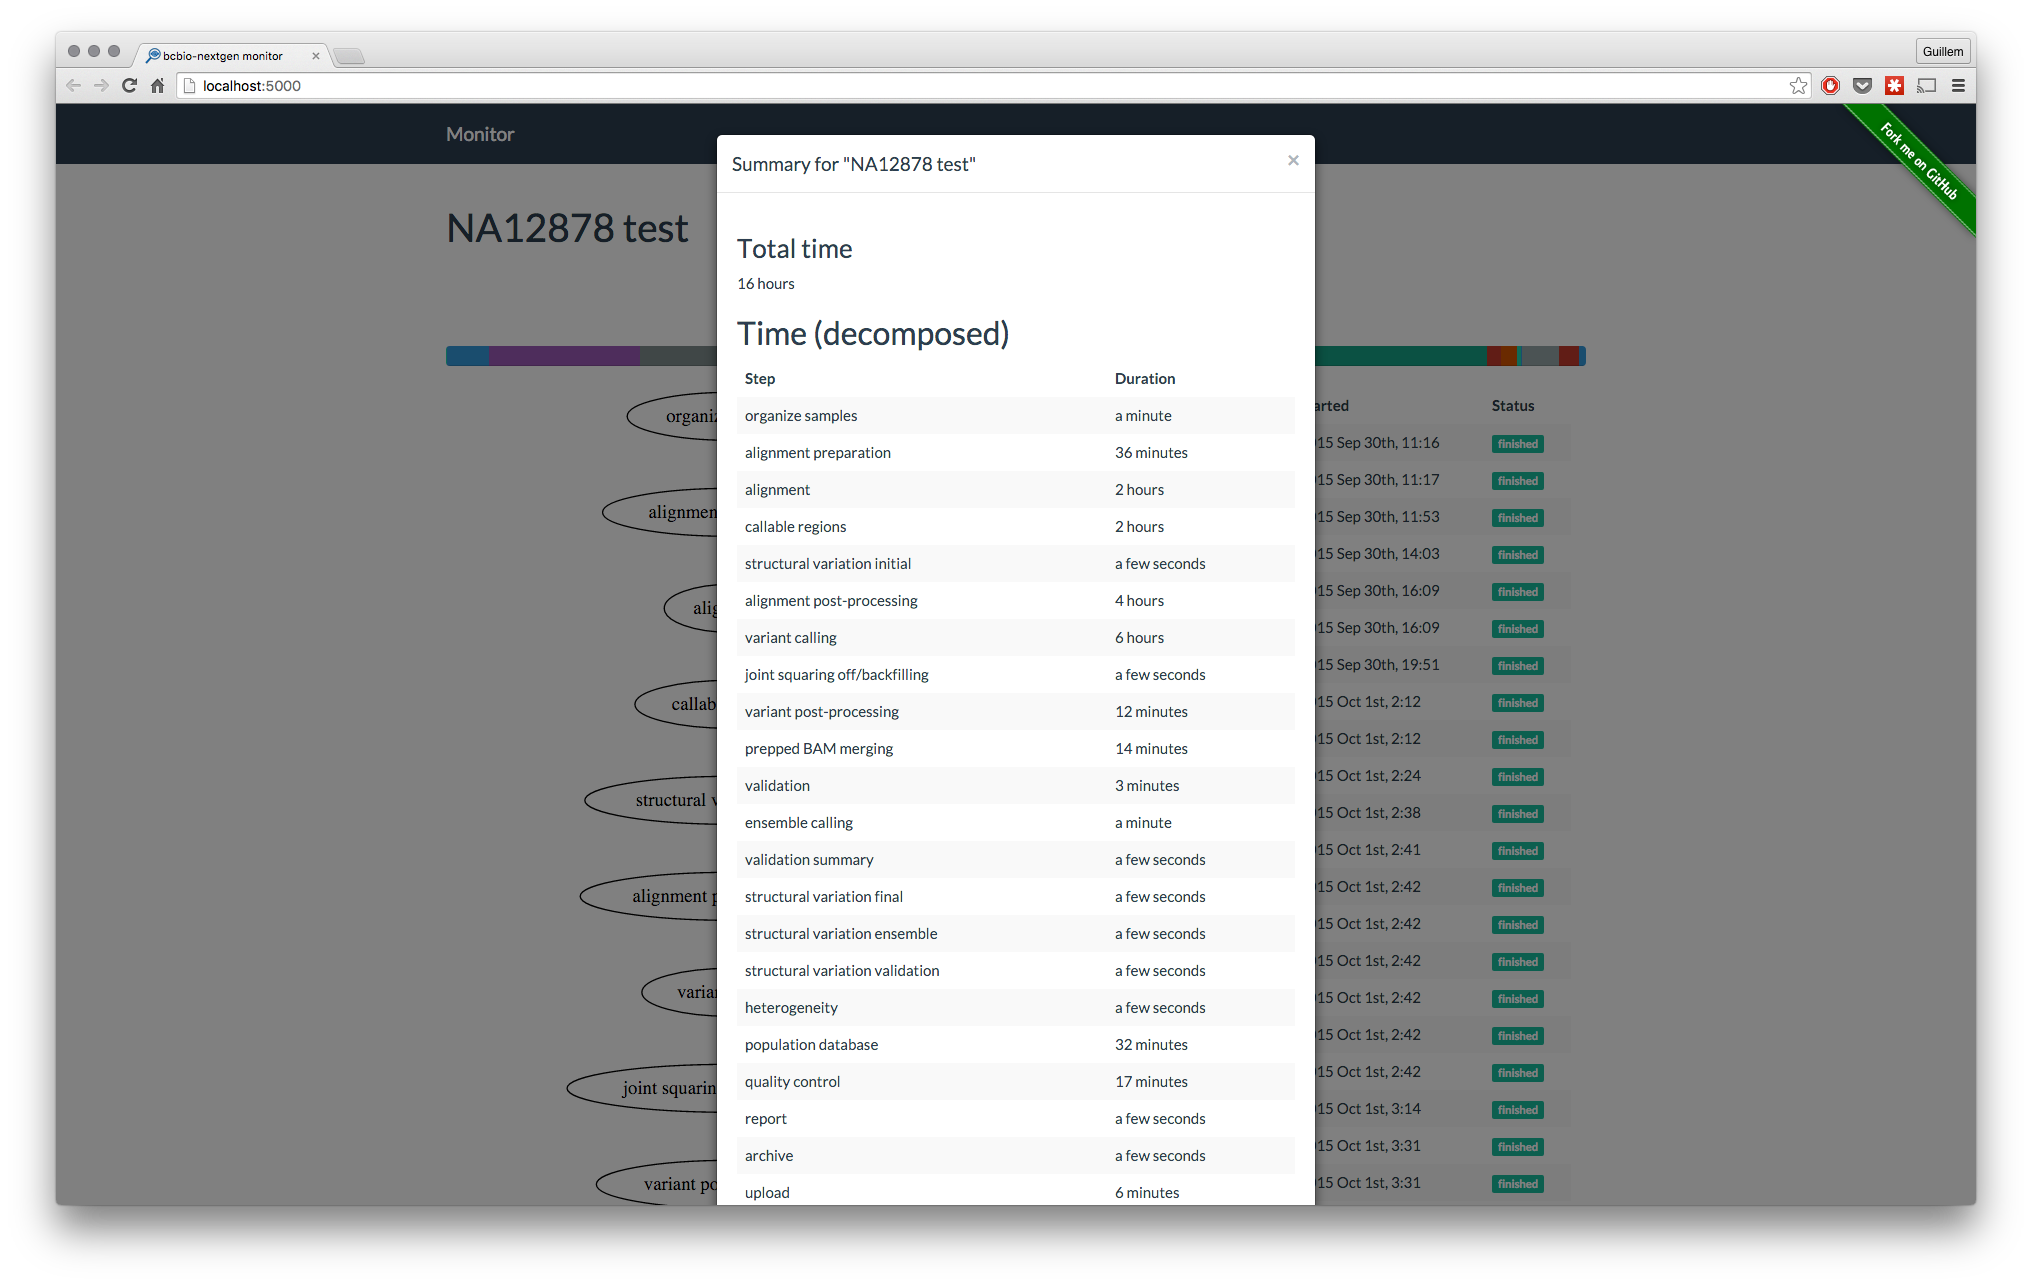
At the end of the analysis, get a summary of the analysis. Same than with the flowchart, this will contain more information in future versions.
Final remarks
Lots of features could (and hopefully will) be added to bcbio-monitor, but this very first version
1.0 is already a working prototype to track bcbio-nextgen analyses. I’m creating a series of issues
for version 1.1, please feel free to add whatever you think could be useful :-).
And as always, share if you liked!